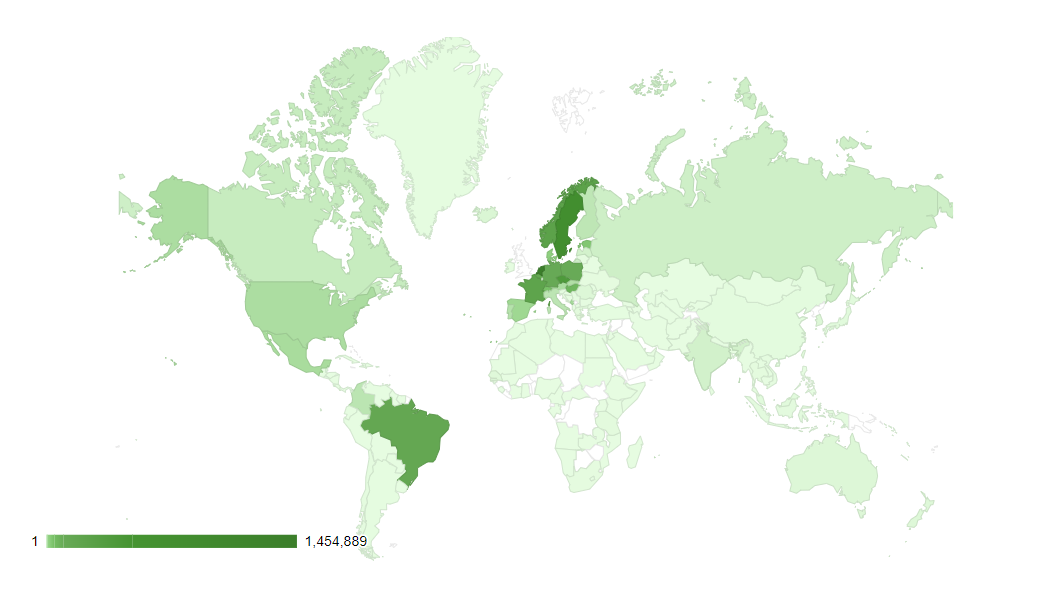
About

Welcome to the INSO Internet Namespace Security Observatory, your trusted source for DNSSEC (Domain Name System Security Extensions) statistics and insights into the global adoption of secure internet namespaces. The website is developed and maintained by Center for Assurance Research and Engineering of George Mason University.

heat-map
DNSSEC Heat Map

A heatmap of DNSSEC (Domain Name System Security Extensions) zones by ccTLD (Country Code Top-Level Domain) visually represents the adoption and implementation of DNSSEC in different countries.
The heatmap color-codes each country's ccTLD based on the level of DNSSEC adoption and deployment within that specific domain.

  • Darker or Hotter Areas: These regions denote a higher concentration of DNSSEC-protected ccTLDs, signaling a strong commitment to internet security.
  • Lighter Areas: These areas indicate a lower level of DNSSEC adoption, highlighting the need for increased security measures and awareness.

Analyzing this heatmap can offer valuable insights into the global landscape of internet security, to identify regions where there might be a need for increased awareness and implementation of DNSSEC to enhance the overall security and reliability of the internet.

heat-map
Hierarchy

The graph provides a visual representation of the number of DNSSEC zones at different levels within the DNS hierarchy. The graph is divided into three main categories: the Root Zone, Top-Level Domains (TLDs), and Domain Zones. Each category is further subdivided to depict the number of DNSSEC zones at that specific level.

The graph visually illustrates the hierarchical structure of DNSSEC zones, with the Root Zone at the top, TLDs in the middle, and a continuously expanding base of domain zones at the bottom. This graphical representation effectively conveys the distribution of DNSSEC zones across the various levels of the DNS hierarchy.

Data Sources

The information utilized by the INSO is sourced from the SecSpider measurement and DNSSEC Deployment Maps projects.